
Your Next Business Decision Might Be Trapped in a Screenshot
Useful business data often arrives as a screenshot. Explore how Pixoate turns table images into editable information for comparisons and calculations.
A screenshot is an excellent way to show what was on a screen. It is a less convenient way to ask new questions of the numbers. Sorting, filtering and calculating all require another step.
Businesses encounter this problem in price comparisons, stock reports and operational summaries. The screenshot records the answer to one view of the data, while the next person needs a different view.
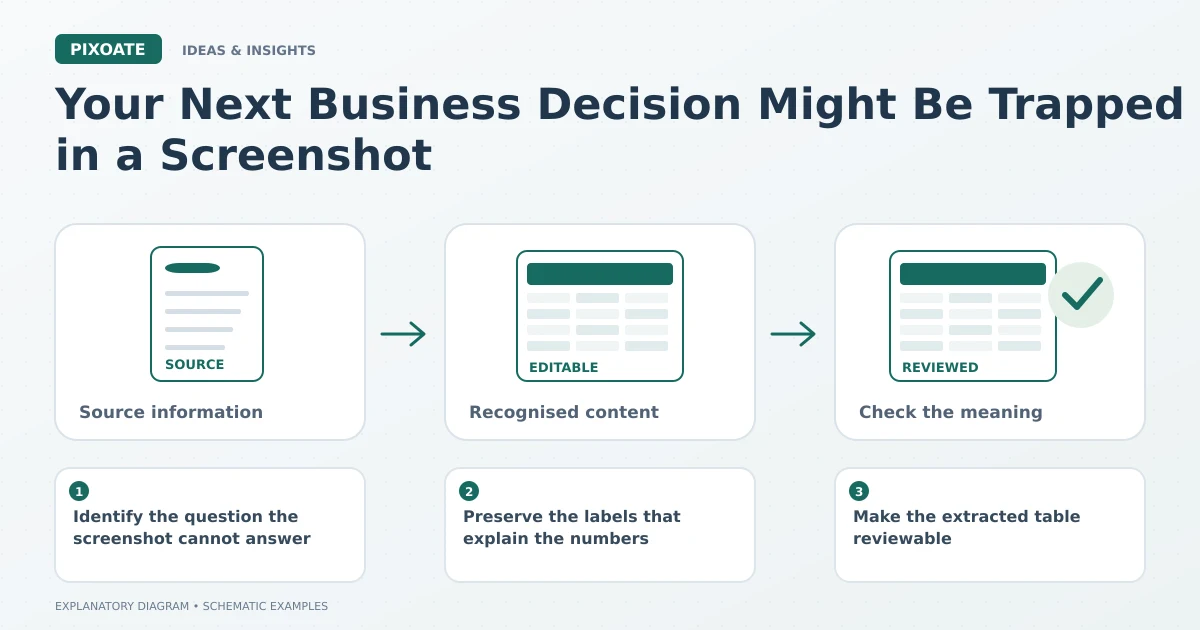
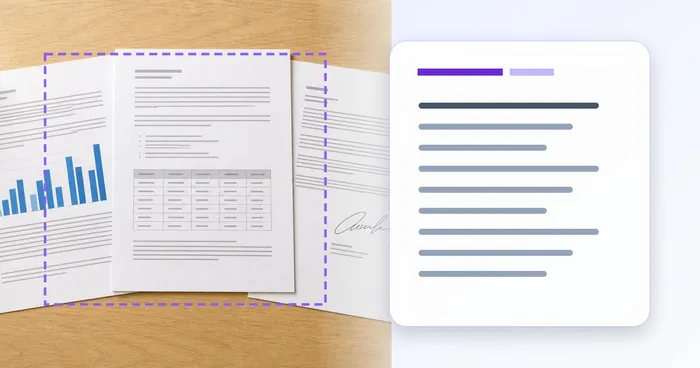
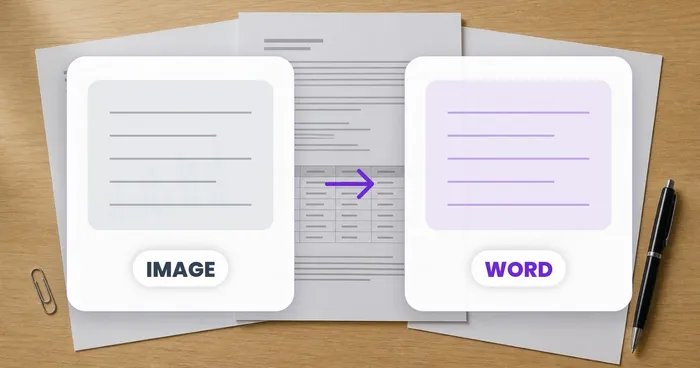
Original explanatory graphic. The scenes and sample records are schematic illustrations, not screenshots or measured tool results.
Identify the question the screenshot cannot answer
Perhaps you need to compare unit prices, sort a stock table or combine several reports using the same item identifier. Write down that next task before extracting anything.
Use Pixoate Image to Excel for an editable workbook, or Image to CSV for a compatible row-import workflow. Choose the destination that supports the analysis rather than copying the image into another document and leaving the data trapped.
Preserve the labels that explain the numbers
A screenshot may omit the reporting period, active filter or unit basis. Keep those details with the source where available. The numbers alone do not reveal whether a report covers a day, a month or one selected location.
Do not infer missing context from a familiar-looking layout. Ask the person who supplied the screenshot if the interpretation affects the decision.
Make the extracted table reviewable
Check the headings and follow several complete rows. Look for cropped final columns, repeated headings and merged descriptions. Verify dates, identifiers and decimal values before creating formulas.
The screenshot contains displayed results, not the original calculation logic. Rebuild calculations only from reviewed inputs and a clear understanding of what they represent.
Keep the decision separate from the conversion
An editable file makes analysis possible; it does not make the underlying data complete, current or representative. Record the source and relevant period, and identify any gaps before drawing conclusions.
For recurring reports, seek a suitable original data export when available. OCR remains useful when the image is the practical source you have, but it need not become an unnecessary detour when structured data already exists.
Use Pixoate Image to Excel to turn a readable screenshot into a reviewed working table. The value lies in the next useful question you can ask of the data.