
A Busy Café Photo Tells One Part of the Demand Story
A busy cafe photo captures occupancy at one moment. Explore Pixoate people counts, their limits and how reviewed snapshots can inform demand discussions.
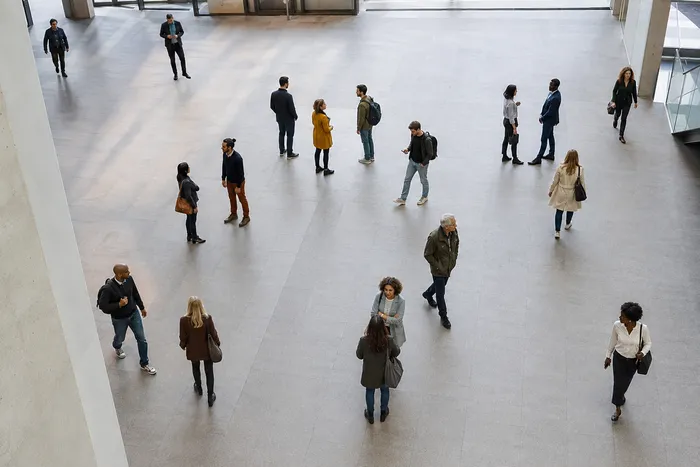
The café looks busy in the photograph. That observation may be useful, but it does not explain how many different customers visited during the day, what they ordered or how long they stayed.
A snapshot shows one moment. Understanding demand requires keeping that moment connected to time and other business information.
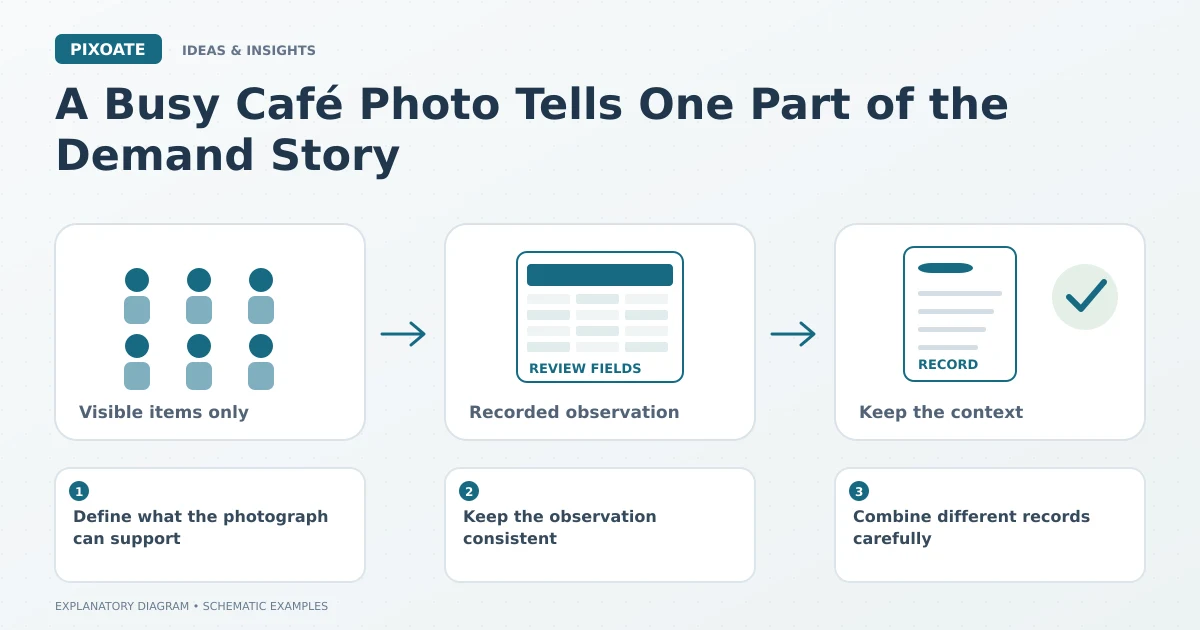
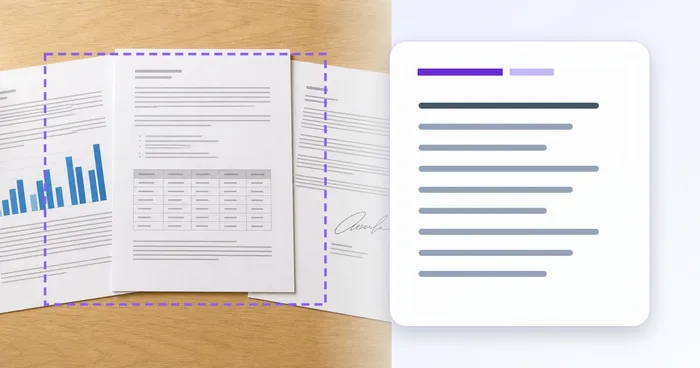
Original explanatory graphic. The scenes and sample records are schematic illustrations, not screenshots or measured tool results.
Define what the photograph can support
Pixoate Count People can provide a preliminary estimate of visible people in a supplied image. Review the result against the photograph and note any occlusion or uncertainty.
A still does not track unique visitors across time or analyse an entire CCTV video as a continuous visitor log. Several photos can contain the same people, so adding their counts together does not establish total daily attendance.
Keep the observation consistent
If the business uses appropriate images for an occupancy review, record the capture time, area shown and counting approach. A close-up of one section is not directly comparable with a wider image of the whole room.
Visible people may include staff as well as customers. Define the group you intend to observe and review the result accordingly rather than accepting a single number without context.
Combine different records carefully
Transaction records, staffing information and reviewed occupancy observations describe different aspects of demand. A crowded room may contain customers who arrived earlier, while a quieter image may miss a period of rapid takeaway orders.
If figures arrive on a paper report, Image to Excel can help create a reviewed working table. Preserve the reporting period and units before comparing it with image observations.
Use estimates for an appropriate purpose
A visual estimate can support a discussion about patterns or future observation. It should not replace approved attendance or capacity procedures, and it cannot prove revenue or individual customer behaviour.
The useful question is what additional information the business needs. A photo may suggest a period worth examining, while the operational records help explain what happened.
Use Pixoate Count People for a reviewed snapshot estimate. Keep the photograph's limits visible, and let broader business evidence supply the rest of the demand story.