
How to Convert Stock Lists and Product Images Into Excel Without Retyping
Turn a photo of a price list or stock sheet into an editable Excel file, check codes, decimals and totals, and keep a record of stock sheets over time.
Written by the Pixoate team. We check how each tool behaves before we describe it, and we date any prices or portal rules we quote.
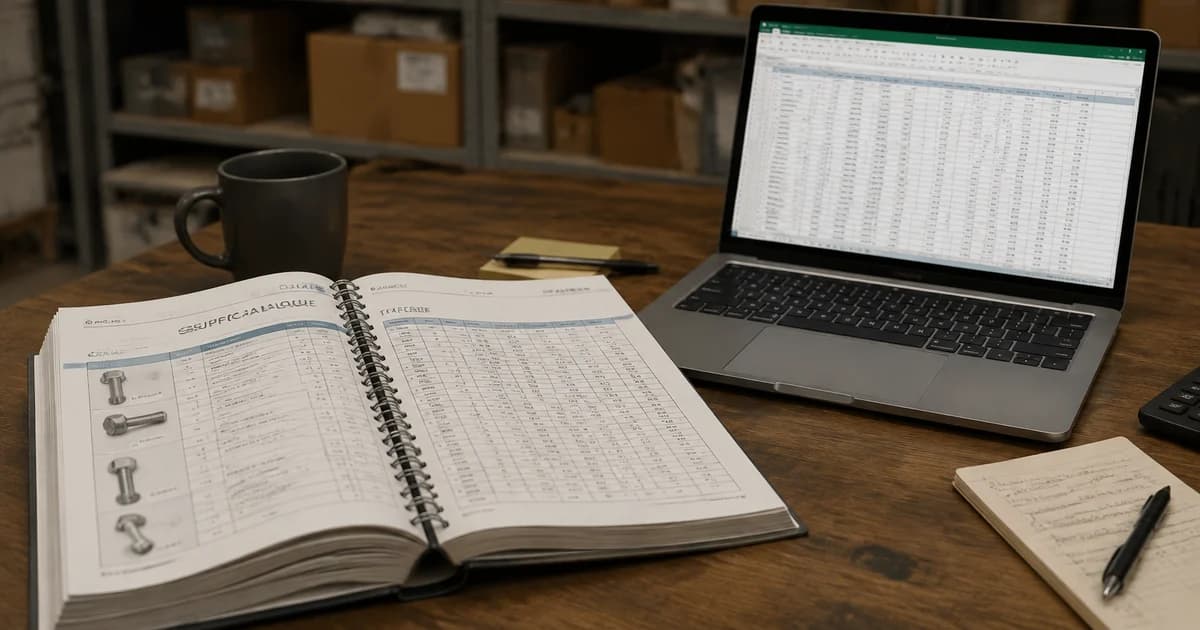
A supplier sends a photo of a price list. A stockroom has a printed sheet with handwritten notes. A colleague shares a screenshot of a spreadsheet instead of the file. All of them contain useful numbers, but none of them can be sorted, totaled or compared with last month's figures until someone retypes them.
Retyping is slow, and the mistakes it creates are hard to spot. This guide shows how to turn a photo of a table into an editable Excel sheet, how to check it properly, and how to keep a record of stock sheets over time.
The workflow in brief
- Use the clearest image you have, straight-on and with every heading visible.
- Convert it to an Excel file and open the result.
- Check headings, codes, quantities, decimals and totals against the source.
- Fix mistakes in the grid before you rely on the numbers.
- Save the checked file, and keep the original image.
Prepare the image
Better input gives a better table.
- Photograph paper straight on, with the whole table in frame and no glare across the numbers.
- Use daylight or even room light, and avoid shadows from your hand or phone.
- Use the original image where possible, because screenshots forwarded through messaging apps lose sharpness.
- If the picture contains other items, crop to the table first and keep the column headings and unit labels.
- For a long sheet, take overlapping sections with readable text, then check each section separately.
Convert the image
Open Image to Excel, upload the image and select its main language. The tool reads the table into an editable grid. You confirm the rows, then download an XLSX file. Every cell in that file is stored as text, which keeps product codes with leading zeros intact. It also means a column of prices will not add up until you convert it to numbers in Excel.
If your next system wants a plain data file, Image to CSV gives you a CSV file instead.
Layouts that behave differently
Not every table behaves the same way when it is read from an image. A clean printed grid with clear lines and one line of text per cell is the easiest. A table without ruled lines relies on spacing to show columns, so narrow gaps can cause neighboring columns to merge. Merged headings, such as a group title spanning three columns, can shift data to the wrong place. Handwritten sheets add another layer of difficulty, because letters and digits vary from one writer to another.
Screenshots from other spreadsheets are often easier than photographs, since the text is sharp, but they may have hidden columns or filtered rows that do not appear in the image. If you notice that totals do not match, ask whether anything in the original was hidden. Set the language option to match the document, and if the first result looks poor, try a clearer image or another reader before you fix everything by hand.
Check meaning, not only spelling
A table can look right and still mean the wrong thing. Check these before you trust it:
| Check | Why it matters |
|---|---|
| Product codes | Codes are labels. Compare them character by character. |
| Units and pack sizes | A case price cannot be compared with a unit price. |
| Decimals | A misplaced decimal can change a figure by a factor of ten. |
| Blank cells | An empty quantity does not mean zero. |
| Dates | 04/05 can mean different dates in different countries. |
| Totals | A correct total can still hide one wrong row. |
If a cell is unclear, leave it flagged and confirm with the source instead of guessing.
An example that goes wrong, and how to catch it
Here is an illustrative scenario with made-up numbers. A supplier sends a photographed price list with three columns: code, pack size and price. You convert it and open the result. The first row reads code 00128, pack 12, price 24.00. Looks fine.
But look at the code column. If Excel opened it as a number, 00128 may have become 128, and a later join against your product list would silently fail. In another row, the price 1,250.00 might have been read as 1.250, because the decimal and thousand separators were confused. That changes a price by a factor of a thousand, and a quick glance would not catch it.
The checks that find these problems are simple. Sort the price column and look at the smallest and largest values, since a misplaced decimal tends to produce an outlier. Compare the number of rows with the source. Check that the codes keep their leading zeros and have a consistent length. And spot-check a handful of rows against the photo itself. Ten minutes of checking beats a month of wrong orders.
Convert the text to numbers yourself
Because cells are stored as text, you need to convert numeric columns before you use formulas. In Excel, select the column and use the option that converts text to numbers, or multiply by one in a helper column. Do this after you have checked the values. Keep product code columns as text.
Keep a record of stock sheets
If you use the inventory sheet converter, signed-in users can save a checked table into a named collection with a History tab, and see a daily chart built from an amount column. The chart adds up the column you pick across every saved row, so remove subtotal and total lines from the table first. That is how you turn a pile of photographed sheets into a trend you can read. Use the Inventory Sheet to Excel tool for that workflow.
Where this saves real time
The time saving is not in the conversion itself, which takes seconds, but in everything that comes after. Once a supplier list is a spreadsheet, you can sort by price, filter by pack size, compare against last month's file and build a reorder sheet. A price list that arrives as a photo cannot do any of that, and a retyped one invites mistakes. Small businesses that receive several lists a month find the saving adds up quickly, particularly when the same supplier keeps the same layout, so the same checks work each time.
Pair it with counting
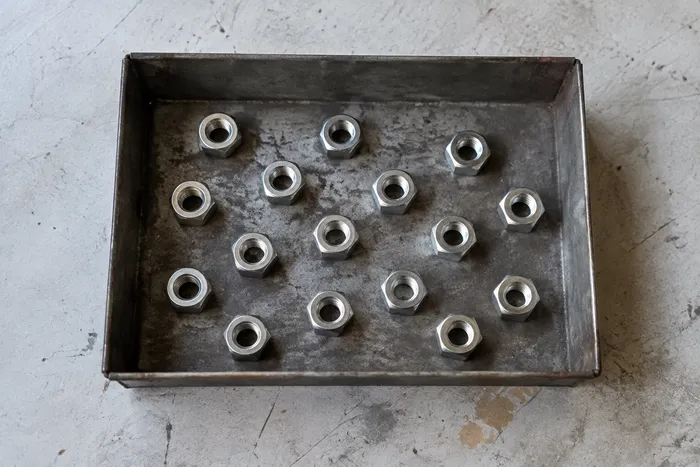
If the stock is on a shelf instead of a sheet, you can count inventory from a photo and put the reviewed number beside the supplier's list. For background on how text is read from images, see what OCR is. If the table is in a PDF instead, read how to convert PDF tables to Excel without retyping, and create daily stock reports once the data is clean.
From a clean sheet to useful decisions
Once the numbers are checked, the spreadsheet starts to pay you back. Sort by price to find the cheapest and most expensive lines. Add a column for unit price by dividing a case price by the number in the case, which makes different pack sizes comparable. Place this month's list next to last month's and look at what changed. A few simple formulas can flag any line that moved by more than a set percentage, so you spend your time on the changes that matter.
If you work with several suppliers, keep each list in its own sheet with the date in the name. Over a few months you build a history of price changes that is useful when negotiating. None of this needs advanced skills, only a clean starting table, which is what the conversion gives you once you have checked it.
Frequently asked questions
How accurate is converting an image to Excel?
It depends on image quality, layout and handwriting. Treat the output as a draft, and check codes, quantities, decimals and totals against the source before you use it.
Will it keep my formulas?
No. A photograph records the displayed result, not the original formula. Add formulas yourself after you have checked the values.
Why do my numbers not add up?
The downloaded file stores every cell as text. Convert the numeric columns to numbers in Excel before you sum them.
What if the layout is messy or merged?
Crop to the table, keep the headings, and check whether a title row has become a data row. Remove it only after comparing with the source.
The conversion takes seconds and the checking takes minutes, and both are worth doing. To try it on a real supplier list, Image to Excel will give you an editable grid to verify against the photo.