
How to Create Daily Stock Reports for a Small Business From Photos and Sheets
Count key lines the same way each day, save reviewed counts, read the trend and combine photos with supplier sheets in Excel.
Written by the Pixoate team. We check how each tool behaves before we describe it, and we date any prices or portal rules we quote.
A small business often knows its stock only roughly. Someone counts the shelves when they have time, the numbers live in a notebook or a spreadsheet, and nobody can say whether a line is running down faster than usual. A simple daily or weekly report changes that, as long as it is easy enough to keep up.
This guide shows how to build a lightweight stock report from photos and sheets, what to record, how to read the trend, and where the method stops being reliable.
The routine in brief
- Choose a small set of products or shelves that matter most.
- Count them at the same time, in the same way, each day or week.
- Review and label each count, then save it.
- Chart the last count per day and look for trends.
- Investigate unusual changes with a recount.
Decide what to report
A report that tries to cover everything is never finished. Start with:
- Fast-moving lines you cannot afford to run out of.
- High-value items where losses hurt.
- Products with long supplier lead times.
- Shelves or areas where mistakes are common.
Five to ten lines are enough to begin, and you can add more once the routine works.
Make counting repeatable
A trend only means something if the counts are comparable. Use:
- The same location and camera position each time.
- The same time of day, such as before opening.
- The same unit, such as bottles, boxes or cases.
- A clear label for each shelf or area.
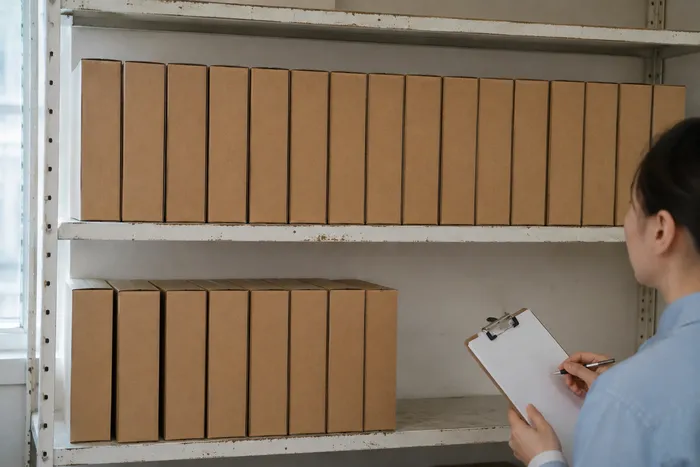
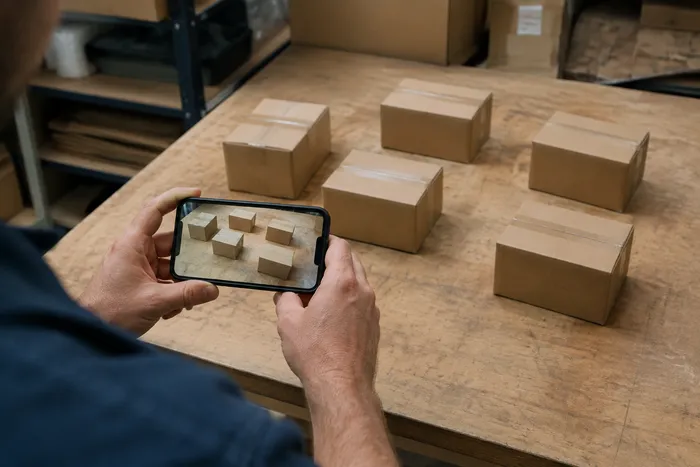
Photograph each shelf or stack front-on in even light, and count one product line per photo where you can.
Count from photos
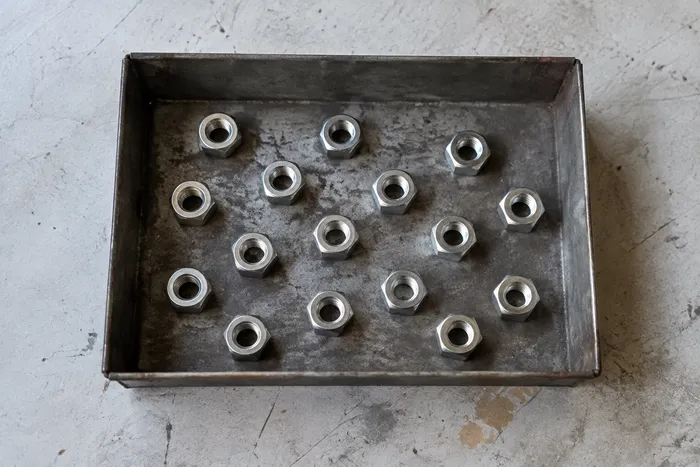
Open the AI Inventory Counter, upload the shelf photo, enter the product and run the count. Review each marker, correct misses and duplicates, then add the reviewed number to your tally with a label such as "Back wall, shelf 2, 500 ml bottles." For the full routine, read how to count inventory from a photo.
Save the counts and see the trend
If you are signed in, Count history lets you create a setup for a product or place, record each new count with the time it was observed, tick that you have checked it, and save it. The history shows the last count recorded each day as a chart, and you can export it as a CSV file. Missing days are shown as missing, not as zero, and several photos on one day are not added together, so take the count you want recorded last.
Add supplier and sales sheets
Your report becomes more useful when you compare counts with deliveries and sales. If supplier lists or stock sheets arrive as photos, convert them to Excel and check the values, as described in how to convert stock lists and product images into Excel. The Inventory Sheet to Excel tool can also save checked tables into a collection and show a daily chart of an amount column.
A worked example: a small hardware shop
Here is an invented example. Imagine a hardware shop that decides to track six lines every morning: two types of screws, one paint, one adhesive, one tape and one popular hand tool. Each morning, the owner photographs the display shelves, reviews the counts and saves them in Count history with the line name.
After three weeks, the history shows a pattern. The adhesive drops quickly on Mondays and Fridays, which is when tradespeople visit. The paint declines slowly and steadily. One of the screw lines sits flat for days, then drops sharply after a delivery is unpacked, which suggests the shelf is being topped up from the back room unevenly.
None of these insights required a complicated system. A few minutes a day, a consistent photo position and a habit of reviewing the numbers gave the owner a picture of how stock moves. They reordered the adhesive before the weekend, moved the slow paint to a smaller display and corrected the shelf-filling routine. The value was not in the count itself but in what it revealed over time.
Read the report sensibly
Look for patterns, not single points:
- A steady decline suggests a line is selling quickly, so reorder earlier.
- A flat line for a slow product may mean overstock.
- A sudden drop deserves a recount and a check of deliveries, sales, damage and transfers.
- A sudden rise may be a delivery you did not log, or a counting mistake.
A photo count estimates visible stock, so a gap is a prompt to check, not proof of loss.
Days of cover and reorder points, explained simply
Two ideas make a stock report far more useful, and both are simple. Days of cover is how many days your current stock will last at the usual rate of sales. If you have 60 bottles and sell about 10 a day, you have six days of cover. A reorder point is the stock level at which you place a new order, so the delivery arrives before you run out. If your supplier takes three days to deliver and you sell 10 a day, you should reorder when you still have enough for the delivery time plus a small safety margin.
Your daily counts give you the starting numbers, and your sales give you the rate. With those you can write a reorder point on the shelf label or in a sheet: when the count reaches this number, order. It is simple arithmetic, but it turns a count into a decision, and that is the point of keeping the report in the first place.
Know the limits
- Hidden stock behind other items is not counted.
- Similar products can be confused.
- A count is only as good as the photo and your review.
- A photo count does not replace your stock or point-of-sale system.
Use the report as an early warning, and keep a regular physical count for the figures that matter for accounts.
Making the habit stick
Most stock routines fail because they are too ambitious. A report that requires thirty counts a day will be abandoned in a week. A report with five counts taken at the same time each morning has a chance. Start small, make it part of opening or closing, and add lines only when the first set is running smoothly.
It also helps to assign the task to a specific person and to make the result visible. A short note on the wall or in a shared chat that says "Adhesive low, reorder" turns a number into an action, and people maintain habits that lead to visible results. When the routine saves a missed sale or prevents a rush order, everyone sees why it is worth the few minutes it takes.
A simple weekly routine
- Photograph and count your chosen shelves at the same time each day.
- Review, label and save each count.
- Once a week, open the history and read the trend.
- Compare it with deliveries and sales.
- Adjust reorder points, and recount anything that looks odd.
Seasons, promotions and unusual weeks
Sales rarely stay steady. Weather, holidays, school terms and promotions all shift demand, so a reorder point that works in a quiet month may leave you short in a busy one. Note in your records when something unusual happened, such as a sale or a local event, so you can explain a spike or a dip later.
Over time, look back at the same period in earlier months and adjust your levels in advance. A shop that sells more cold drinks in hot weeks, or more paint at the start of spring, can raise its levels before demand arrives. The report does not predict the future, but with a few months of notes it helps you recognize patterns, and recognizing patterns is most of what good stock management means.
Related guides
For the wider picture, see our overview of counting from photos.
Frequently asked questions
How often should I count?
Daily for critical lines and weekly for slower ones is a common starting point. Pick a schedule you can keep.
Can I connect the report to my sales system?
Not automatically. You export a reviewed tally or CSV file and combine it with your own data.
What if the count looks wrong?
Check the example you marked, the lighting and whether items are hidden. Retake the photo or count by hand.
Is a photo count enough for my accounts?
Treat it as a reviewed estimate. Use your normal physical count for year-end and audit figures.
A report people keep up beats an ambitious one they abandon. Five lines counted with the AI Inventory Counter for a week will show you whether the routine is worth extending.